Each month the Center for Workforce Information and Analysis releases localized labor market reports. The reports include a County Profile that provides a compilation of selected economic and demographic data specifically for Lancaster County including:
- Map of Pennsylvania with the county highlighted
- Population of the county (total, projected and age distribution)
- Labor Force and unemployment rate
- Personal income (per capita, total and median household)
- Major employers
- Employment and wages by industry sector
- Wages by major occupational grou
The civilian labor force data are counts by geographic area of those in the labor force (individuals aged 16 and above who are working or looking for work), the employed, the unemployed and a calculation of the unemployment rate. The purpose of the Civilian Labor Force data is identification of the extent and nature of unemployment. Policymakers use the information, together with other economic data, to make decisions as to whether measures should be taken to influence the future course of the economy or to aid those affected by joblessness. County data is produced on a seasonally adjusted basis for comparability with seasonally adjusted state and national data. Seasonal adjustment eliminates the influences of weather, holidays, the opening and closing of schools, and other recurring seasonal events from a time series, allowing economic trends to be more observable from month to month.
While it is noted nationally y locally that employment growth exceeded predictions and unemployment fell to historic levels, the continued decrease of unemployed, or those who make up one half of the labor force participation equation (employed + unemployed = labor force participation) has workforce professionals and economists concerned. There are many speculations of the exodus from the labor force all-together, with some backed by data such as the occupation age demographics of our county. Of total employment in the county, 7.4% our our current workforce is age 65+ (19k workers), followed by the next age category of 55-64 years, which makes up a whopping 18.5% of our entire labor force. Retirements will certainly continue to be a top cause for labor force exit, with other reasons being remote work out of the county, realignment of work-life balance, while others still remain sidelined due to their own health issues or to care for others. With wages continuing to rise and childcare still a scarce resource, some families are testing out single paycheck households.
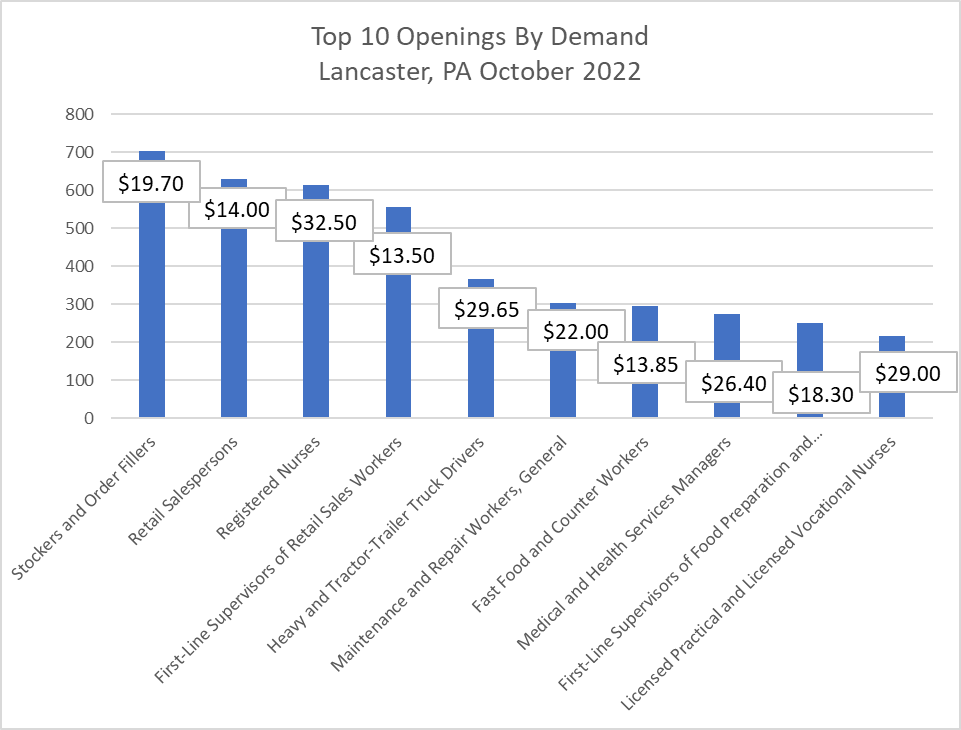
The demand in October 2022 in Lancaster, PA remained strong, with over 14,000 active job postings by over 2.7 thousand employers. With non-seasonally adjusted unemployment numbers falling to 7,300, that means there is approximately 2 job openings for every job seeker. Oh, if it were only that simple! We know that matching a jobseeker with a job opening is much more than just meeting a quota. Open positions in the current labor market require a variety of hard and soft skills and educational levels. 26% of the open positions require a high school diploma, followed by 13% requiring a bachelors degree and less than 3% require a master’s degree. What about those hard to categorize certificates and degrees, less typically 2 years or less? Those are in very high demand! 54% of online job postings require a specific certification or combination of experience and skills with median wages of $18.97/hr.
The top 10 in-demand jobs and their median wages for Lancaster County, PA in October 2022 are illustrated in this chart below: